
Week 1 of my 10-week cut in 3 bullets:
- I lost 1.0 kg (2.2 lb) in 7 days, from 83.9 kg (185 lb) to 82.9 kg (183 lb), on an average of 1,894 kcal per day and 152 g of protein.
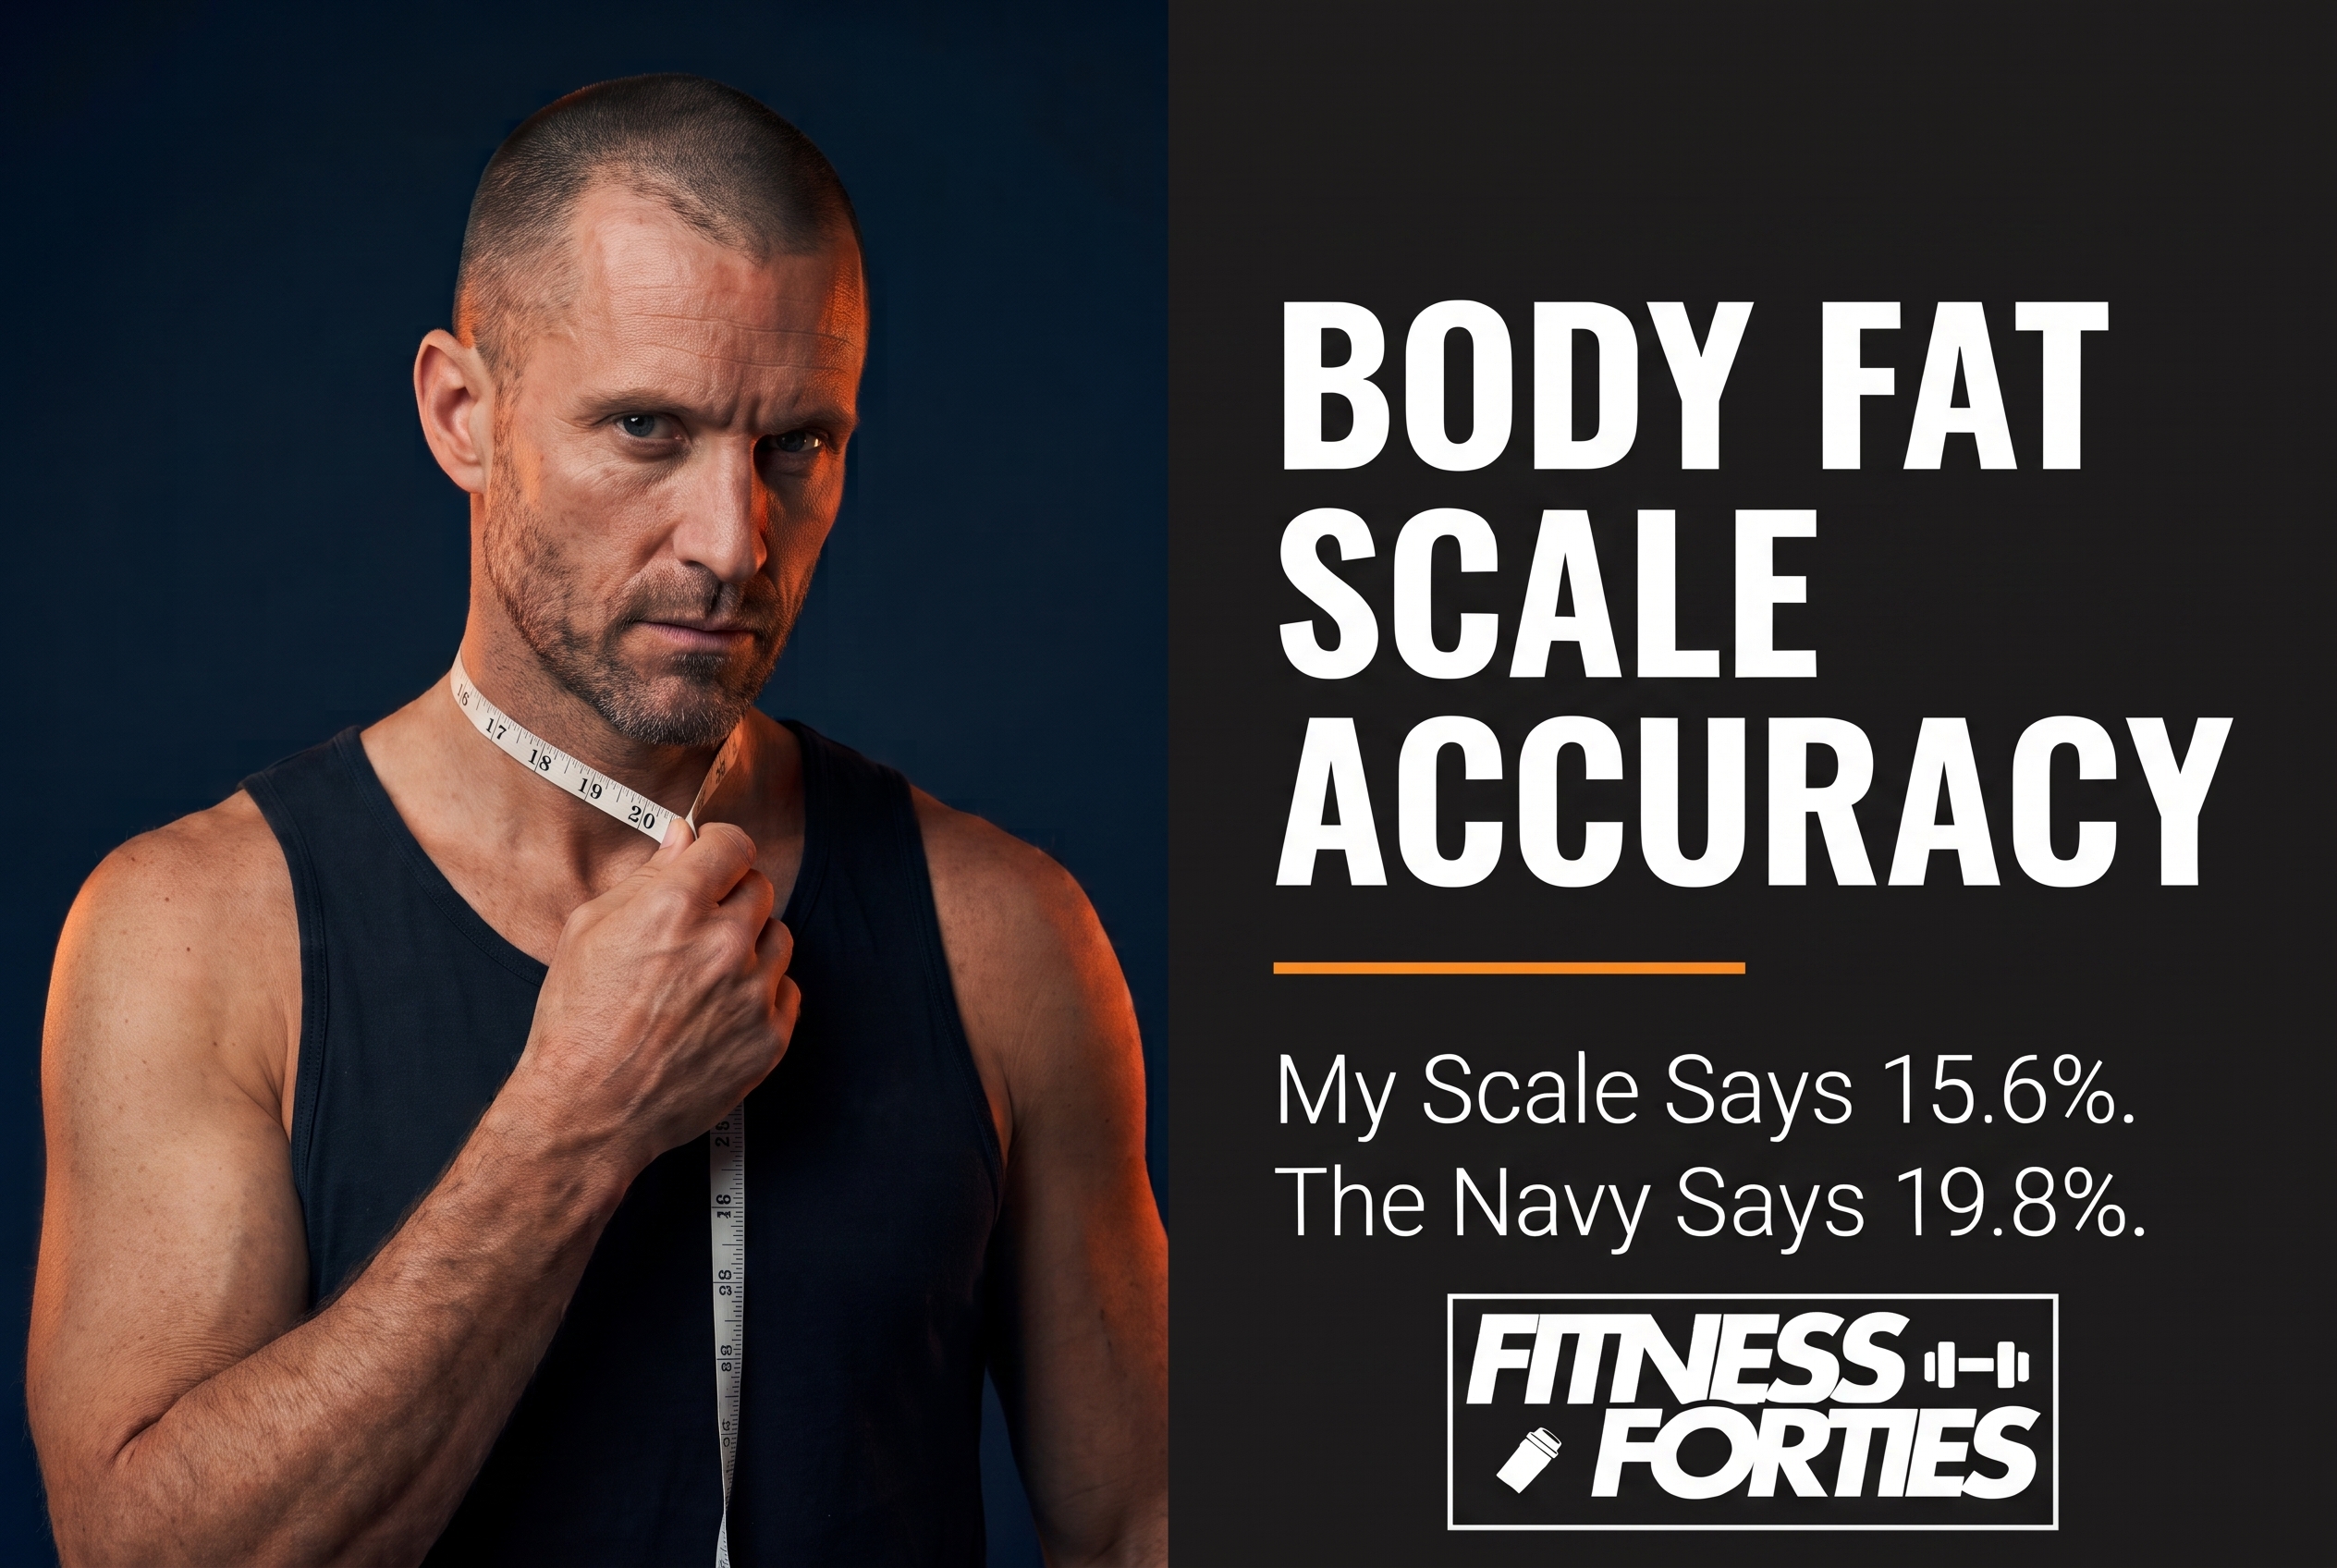
- My smart scale claims 15.6% body fat. The US Navy circumference formula, run on my own tape measurements, says 19-20%. The honest answer sits closer to the tape.
- The scale also showed my body fat percentage going UP and my lean mass going DOWN this week. Both readings are misleading, and I’ll show you exactly why.

- What week 1 of the cut actually looked like
- Body fat scale accuracy: what my smart scale got wrong
- The Navy formula says 19-20%. My scale says 15.6%. Who’s right?
- The tape measure isn’t innocent either
- The numbers: week 3 of the comeback, week 1 of the cut
- What I’m fixing in week 2
- Frequently asked questions
- Final thoughts
If you own a smart scale, this post might save you from quitting your diet in week 1. Body fat scale accuracy is the theme of this check-in because my own scale spent the week lying to me: it told me my body fat went up and my muscle went down, in the same 7 days I lost a kilogram while eating 152 g of protein a day and training 4 times. Both readings are wrong, both have boring technical explanations, and both are exactly the kind of thing that makes men over 40 abandon a perfectly good cut.
This is week 3 of my public comeback log and week 1 of the 10-week cut I laid out in my cutting after 40 plan. Everything below is my real data, measured fasted on Sunday morning, including the numbers that make me look bad.
What week 1 of the cut actually looked like
On paper, week 1 was a success: 1.0 kg (2.2 lb) down, 4 training sessions completed, protein averaging 152 g per day. In reality, it was messier than the plan, and the messy parts are more instructive than the wins.
My calorie target is 2,200 kcal per day. I averaged 1,894 kcal across the 6 fully logged days. That sounds like discipline. It isn’t. Restarting calorie tracking during a heavy office week meant I skipped food instead of planning it: 2 days landed around 1,600 kcal, which is too low for a 47-year-old lifting 4 times a week. Under-eating on a cut isn’t a bonus, it’s a different mistake. It risks muscle, wrecks training quality, and builds the kind of hunger debt that ends diets in week 4. My protein averaged 152 g, which at 82.9 kg (183 lb) works out to 1.83 g per kg of bodyweight. That’s inside the evidence-based range for preserving muscle in a deficit, but my low days were low exactly when I trained, which is the worst place for them.
The pattern behind it is one I’d bet most of you share: my dinner carried 42% of my weekly calories, breakfast only 20%. When work compresses the day, the morning meal is the first casualty, and protein goes down with it. If you want the full protein math for our age group, I’ve run the numbers in how much protein per day after 40.
Training: 4 sessions from the split I described in my honest workout split comparison, with the 4th completed Sunday after these measurements were taken. No missed lifts, but 2 sessions ran on those 1,600 kcal days and felt exactly as flat as you’d expect.
Body fat scale accuracy: what my smart scale got wrong
No. Consumer body fat scales are typically off by 3-8 percentage points against reference methods, and week to week they mostly measure your hydration, not your fat. Reviews of bioelectrical impedance analysis (BIA), the technology inside every smart scale, consistently find that readings swing with water, glycogen, food timing, and even foot placement [1]. Body fat scale accuracy is good enough for one thing only: the long-term trend, measured under identical conditions.
Here’s how that played out on my own scale this week, with 2 readings that would scare anyone who didn’t know better.
Lie number 1: “you lost 0.4 kg of muscle”
My lean mass reading dropped 0.4 kg (0.9 lb) this week, with a little red arrow to make sure I felt it. Losing that much actual muscle in 6 days while eating 1.83 g/kg of protein and training 4 times is close to physiologically impossible. What really happened: a calorie deficit empties muscle glycogen, every gram of glycogen holds roughly 3 g of water, and a BIA scale can’t tell water inside muscle from muscle itself. It reads departing water as departing “lean mass”. The glycogen and the water come back the first higher-carb day. The muscle was never gone.
Lie number 2: “your body fat percentage went up”
Same morning, same scale: body fat percentage UP, with weight DOWN a kilogram. This one isn’t even a sensor error, it’s arithmetic. Body fat percentage is fat mass divided by total weight. If water leaves the lean side of the equation faster than fat leaves the fat side, the percentage ticks up while you’re getting leaner in absolute terms. In week 1 of any deficit, water dominates everything, so the percentage is the single least trustworthy number on the display. If you remember one thing about body fat scale accuracy, make it this: in week 1, the percentage is noise.
If I were guessing why people abandon cuts in the first 2 weeks, these 2 readings would be my top suspects. The scale punishes you precisely when you’re doing everything right.
The Navy formula says 19-20%. My scale says 15.6%. Who’s right?
Probably neither exactly, but the tape is closer. The US Navy circumference method estimates body fat from 3 numbers you can measure yourself: abdomen, neck, and height. Run on my measurements, it puts me at 19-20% body fat, a full 4 points above my scale’s flattering 15.6%.
Small personal note: I actually served in the Navy, the Italian one. Nobody handed us a body fat formula back then, the uniform did the judging. So consider this the one time in my life I take measurement orders from the Americans.
The formula was developed by the Naval Health Research Center and validated against underwater weighing on over 600 subjects [2]. For my numbers: abdomen 94.2 cm (37.1 in), neck 41.7 cm (16.4 in), height 182 cm (6 ft). The formula takes the log of abdomen minus neck, which for me lands the estimate around 19.8%. It has its own error margin, roughly plus or minus 3 points, but it fails in the opposite direction from BIA: it can’t be fooled by hydration, because a tape doesn’t care how much water you drank.
A useful sanity check for any man: a genuine 15.6% at my height almost never comes with a 94 cm (37 in) navel measurement. Visible upper abs, yes. My mirror and my waistband both vote with the Navy. So my working assumption on body fat scale accuracy for this cut is that I started around 19-20%, my scale reads about 4 points optimistic in a stable way, and both numbers will be tracked for their trend, not their absolute value. When my scale eventually shows 12%, I’ll celebrate reaching a real 16%.
The tape measure isn’t innocent either
Before you throw away the scale and worship the tape: measurement error lives there too, and I stepped right into it this week. My measuring app reports a “waist” of 91.2 cm (35.9 in), taken at the natural waist above the navel. My comeback log has been tracking waist at navel level, which today reads 94.2 cm (37.1 in). Same body, same morning, 3 cm (1.2 in) apart, purely from tape placement. If I quietly swapped sites between weeks, the log would show a miracle that never happened.
Tape rules I follow, learned the hard way (including a chest reading in week 1 of this log that I still don’t believe): same site every time, marked by a fixed landmark like the navel. Same tension, snug but not compressing. Same conditions, fasted Sunday morning before coffee. And no conclusions from any single week: a 0.5-1.0 cm (0.2-0.4 in) swing is within honest measurement error, so I only trust moves confirmed across 2-3 weeks. The tape wins over the scale not because it’s precise, but because its errors don’t drift with hydration. Fat loss shows up at the navel with a delay of weeks, not days.
My Sunday measurement protocol
This is the exact 5-minute routine behind every number in this log, and it matters more for body fat scale accuracy than which gadget you buy. Sunday morning, fasted, after the bathroom, before coffee or water. Scale first, standing still on bare feet, same spot on the floor. Then the tape: navel waist, chest at nipple line, both arms relaxed at the widest point, always in that order so I never wonder later which was which. Everything goes into the log immediately, including numbers I do not like. The whole ritual costs less time than arguing with the scale about whether it is right. It never is, exactly. But done the same way 10 Sundays in a row, it cannot hide a trend.
The numbers: week 3 of the comeback, week 1 of the cut
The full log continues on the comeback log page. This week’s row, measured Sunday, August 30, fasted:
| Metric | Week 2 (Aug 23) | Week 3 (Aug 30) | Change |
|---|---|---|---|
| Weight | 83.9 kg (185.0 lb) | 82.9 kg (182.8 lb) | -1.0 kg (-2.2 lb) |
| Waist at navel | 95.9 cm (37.8 in) | 94.2 cm (37.1 in) | -1.7 cm (-0.7 in) |
| Chest | 109.8 cm (43.2 in) | 108.3 cm (42.6 in) | -1.5 cm (-0.6 in) |
| Arms R/L | 34.8 / 35.5 cm | 34.8 / 35.0 cm | 0 / -0.5 cm |
| Scale body fat (trend only) | 15.4% | 15.6% | +0.2 pts (water math) |
| Sessions | 2 of 4 | 4 of 4 | back on plan |
| Avg calories (6 logged days) | not tracked | 1,894 kcal | target 2,200 |
| Avg protein | not tracked | 152 g (1.83 g/kg) | target 165 g |
Reading it honestly: the 1.7 cm waist drop is bigger than 1 week of fat loss can deliver, so part of it is water and part is probably tape luck. The weight drop of 1.0 kg in week 1 of a deficit is mostly glycogen and water too, which is expected and fine. Body fat scale accuracy aside, the number I will actually judge this cut by is the navel trend from week 3 to week 6. Target pace once water settles: 0.4-0.6 kg (0.9-1.3 lb) per week, which the research on preserving muscle during fat loss supports for lifters at my body fat level [3].
What I’m fixing in week 2
One structural fix, not 10 resolutions: breakfast becomes a protein anchor. 30-40 g of protein before the office day starts, non-negotiable, because every macro miss this week traces back to compressed mornings. That single change pulls the daily average toward 165 g of protein and, counterintuitively, means eating MORE total food: my week 2 target is to actually hit 2,200 kcal, not to undershoot it again. Fat stays around 55-65 g per day, because 46 g is lower than a 47-year-old’s hormones should run on for 9 more weeks. Carbs land where they land after protein and fat are placed, ideally around training days.
Frequently asked questions
Is body fat scale accuracy good enough to trust?
Not in absolute terms: body fat scale accuracy on consumer BIA devices commonly deviates 3-8 percentage points from reference methods, and daily readings swing with hydration and glycogen [1]. They’re useful for one thing: tracking your trend over weeks under identical conditions, fasted, same time, same day. Treat the absolute number as a house brand of measurement, not a fact about your body.
Why did my body fat percentage go up while I was losing weight?
Because body fat percentage is a ratio, not a measurement. Early in a diet you lose glycogen and water, which BIA counts on the lean side of the ratio. When the lean side shrinks faster than the fat side, the percentage rises even though you’re leaner in absolute terms. It usually corrects itself within 2-3 weeks as water stabilizes.
How accurate is the Navy body fat formula?
The Navy circumference method was validated against underwater weighing with a standard error around 3.5 percentage points [2]. That’s a real margin, but its errors are stable: a tape isn’t fooled by water weight or a salty dinner. For self-tracking at home, the combination of navel tape plus a consistent scale trend beats either tool alone.
How fast should a man over 40 lose weight on a cut?
Around 0.5-1.0% of bodyweight per week, and the lower half of that range if you care about keeping muscle, which after 40 you must [3]. For me at 82.9 kg (183 lb), that’s 0.4-0.6 kg (0.9-1.3 lb) per week. Week 1 always overshoots because of water. Judge your pace from week 3 onward, never from week 1.
Final thoughts
The 80/20 of this week on body fat scale accuracy: your measuring tools disagree with each other, and every one of them is lying to you a little. The scale flatters your body fat by 4 points and panics about muscle you didn’t lose. The tape tells a different story depending on where you put it. The fix isn’t better gadgets, it’s boring consistency: same tools, same conditions, same sites, and judgment reserved for 2-3 week trends. That discipline costs 5 minutes every Sunday and it’s the difference between quitting in week 2 and finishing in week 10.
Next check-in lands Sunday. If you want the whole journey, numbers and mistakes included, the comeback log updates weekly, and the newsletter gets the check-ins first. Body fat scale accuracy stays a running theme there, one Sunday at a time.
References
- Kyle UG, Bosaeus I, De Lorenzo AD, et al. Bioelectrical impedance analysis, part I: review of principles and methods. Clinical Nutrition. 2004;23(5):1226-1243.
- Hodgdon JA, Beckett MB. Prediction of percent body fat for U.S. Navy men from body circumferences and height. Naval Health Research Center, Report No. 84-11; 1984.
- Helms ER, Aragon AA, Fitschen PJ. Evidence-based recommendations for natural bodybuilding contest preparation: nutrition and supplementation. Journal of the International Society of Sports Nutrition. 2014;11:20.


Leave a Reply